The prospective studies carried out on the French electricity mix by the CMA / MINES ParisTech, use a model from the family of TIMES models, which:
- represents the French electrical system (metropolitan France without Corsica), calibrated on the year 2012;
- makes investment decisions by minimizing the total discounted cost (taking into account the fixed and variable costs of the means of production, their yield and their use over their lifetime) over the 2012-2050 period;
- proposes a wide range of possible investments over the period under review: means of production and storage, erasure and interconnections;
- is consistent with the constraints specific to the operation of electrical systems, especially with the supply-demand balance constraint at each moment.
The technological description used in this model allows a detailed representation of the French electrical system as shown in Figure (1).

Figure 1 : Schematic description of the electrical system represented in our model
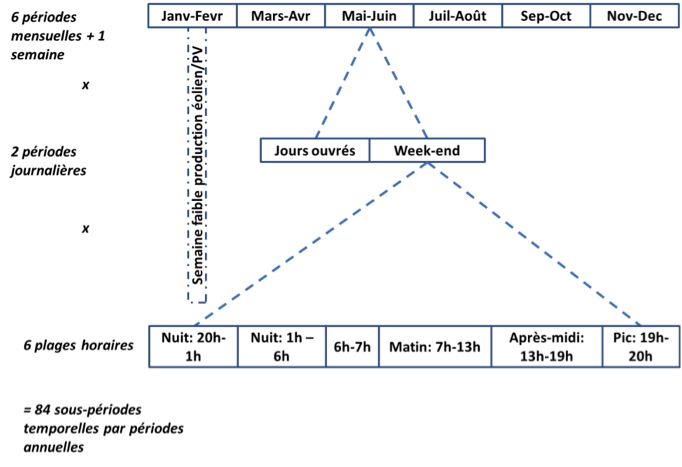
At the temporal level, the 2012-2050 trajectory is divided into 13 periods, each aggregating several years. Each period is subdivided into 84 sub-periods to capture seasonal, weekly, and daily variability as well as the availability of wind and solar resources, as shown in Figure (2).

Figure 2 : Subdivision of periods into 84 sub-periods
In order to refine the power sizing of the electrical system, a constraint imposes the installation of additional capacities to cope with hazards (maintenance, breakdowns, etc.) and potential consumption peaks that would be higher than those represented in the model, with the peak factor given in Figure (3). The variable renewable energies (wind, photovoltaic and marine energies), because they are not controllable, do not participate in this constraint of sizing the electric generating fleet.

Figure 3 : Power sizing of the electric generating fleet
The curves in red and blue represent respectively the day of weakest and highest consumption of the months of January and February. The rectangles represent the load curve used in the model for this sub-period.


