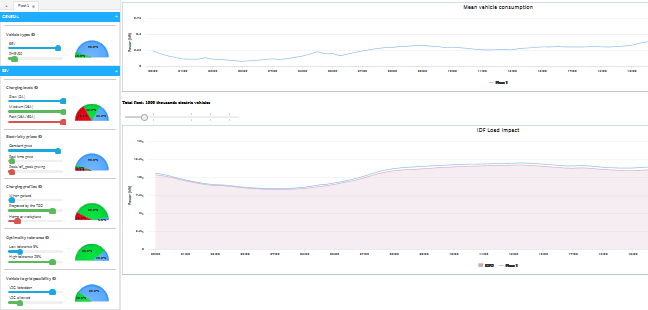
The application allows to set or modify some statistical properties, in a fleet of electric vehicles, and to simulate its behaviour regarding the total load power profile.
Interface layout
The application interface presents a left hand side control area and a right hand side resulting graphs area.

Control area
Control is organized as a column of subwindows. Each sub-window is devoted to a particular attribute or property of the vehicles, such as type, allowed load current, …
A sub-window has a label, a group of sliders, and a half-pie.
The label is the name of the particular property. It has a question mark button which gives a short information.
The property may have two or three values. The relative statistical percentages of these values in the population are controlled by a group of two or three sliders and displayed in a half-pie.
WARNING
Each slider in a group allows to increase or lower its associated value, but as a side effect, it modifies also the other values in such a way that the sum remains always 100%.
So, when you drag a slider all the percentages are modified, and many sliders positions lead to the same pie repartion, as in the two following figures.

Resulting graphs
The top graph represents a one day reloading power profile for a virtual mean vehicle.
The bottom graph represents the impact of the reload on the load curve of Ile de France. This impact is obtained for a particular total number of vehicles. This number of vehicles is controlled by a slider on top of the graph.


